
Disclaimer: Author holds ETH & SOL and may have intra-day/week positions and/or airdrop allocations in other coins mentioned in the article. Views and opinions are that of the author alone and do not represent the views or opinions of Etherscan. None of this is financial advice. Always do your own research before aping.
Note: We launched “The Spread”, our new trader-focused monthly newsletter! Read our announcement here.
Welp, another month of choppy conditions during which most market participants would have better spent time touching grass than trading coins.
Bitcoin & the Broader Market
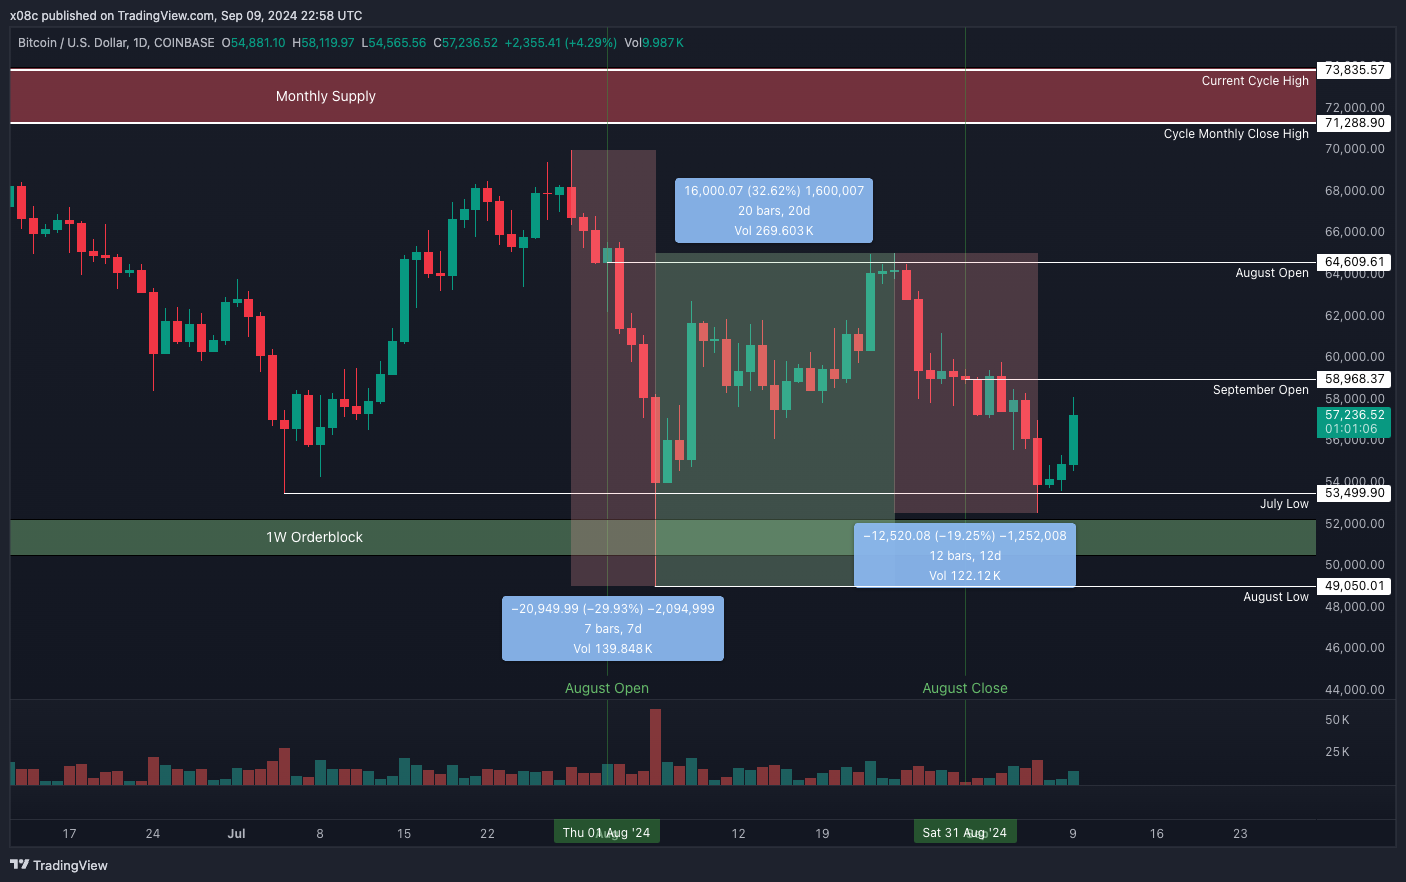
As described by Impulse 3 in last month’s edition, BTC had a 30% downmove from July’s high of $70k to a low of $49k in the first week of August, representing the continuation of a 6 month downtrend of lower highs and lower lows since printing the current cycle high of ~$73.8k mid-March.
Following the flush on August 5th, Bitcoin showed strength. Firstly by reclaiming July’s low at ~$53.5k by the 1D close and then continuing to trend up over a 20 day period before rejecting from August’s Open just shy of $65k, printing another macro lower high. Price has since come back down to sweep July’s low at the end of the first week of September, reclaiming the level by the 1D close and moving swiftly up - much like it did in August. A key difference however, being the printing of a potential higher low of $52.6k in September, which shows some constructive technical evidence for a downtrend reversal.
Immediate high timeframe resistance sits at September Open ~$59k, while the more crucial test waits at August Open - a close above which would print a higher high, providing more evidence of an uptrend forming and thus paving a path to test monthly supply in the $71-74k region.
ETF Flows
August saw Bitcoin Spot ETF net outflows totalling $92.2m, the second worst month since inception after April’s $345.1m. September is also off to a poor start with outflows totalling $418.3m in the first 4 trading days.
Seasonality
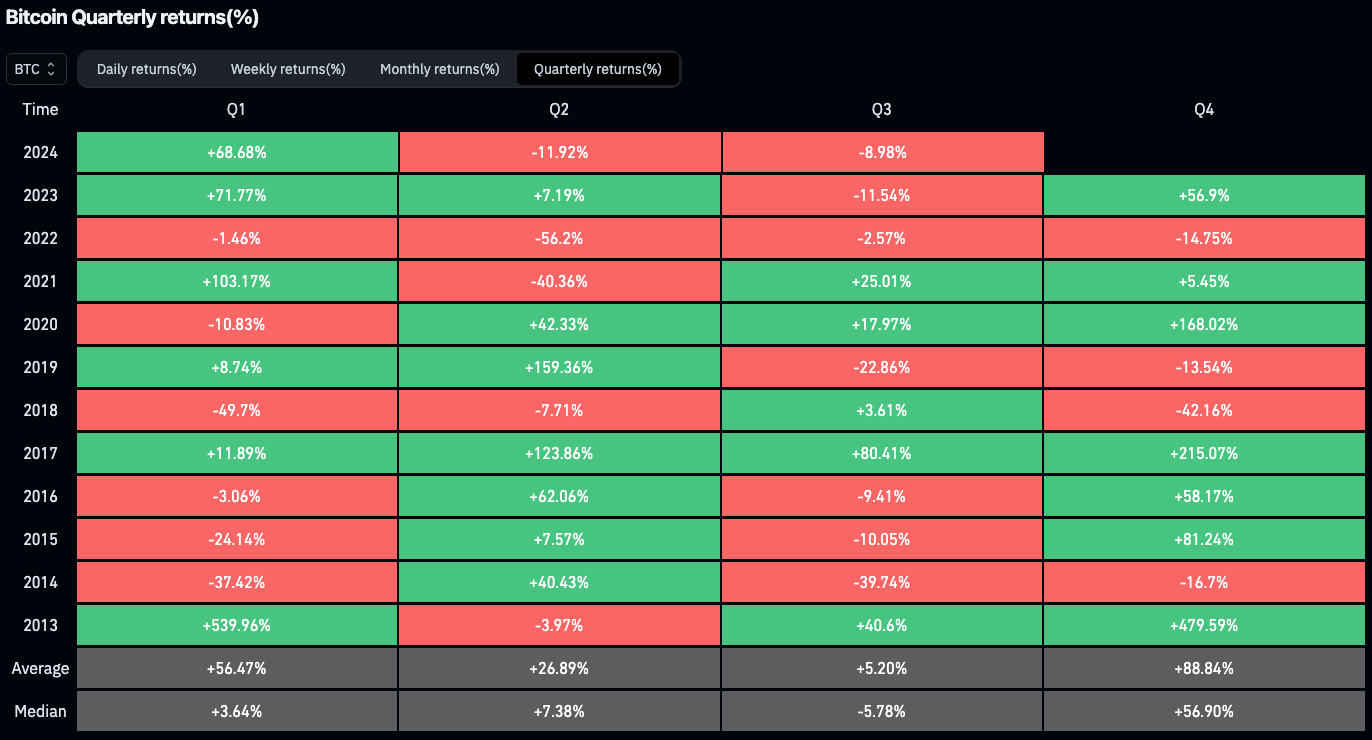
September is historically the worst month for BTC performance, with the month closing red for 7 out of the past 11 years. However, Q4 tends to be bullish, with only 11 red months printed out of a potential 33. Moreover, during the past 3 halving years - 2016 and 2020 - Q4 saw only green monthly prints averaging 17% and 39.2% respectively, translating into quarterly gains of 58.18% and 168% respectively.
Elections
Both Polymarket and Drift have Trump and Harris sharing relatively even odds of winning the Presidential Election. Although Trump undoubtedly has a more pro-crypto stance, Bitcoin has largely overcome its regulatory obstacles in the US. Increased expectations of a Trump win would likely be more bullish for the rest of the market which are still in relative regulatory limbo in the US. The recently announced Trump crypto project World Liberty Financial, along with recent strength shown by leading money-market platforms Aave and Kamino perhaps suggests a Trump win would be particularly bullish for the DeFi sector.
Aggregate Stablecoin MarketCap
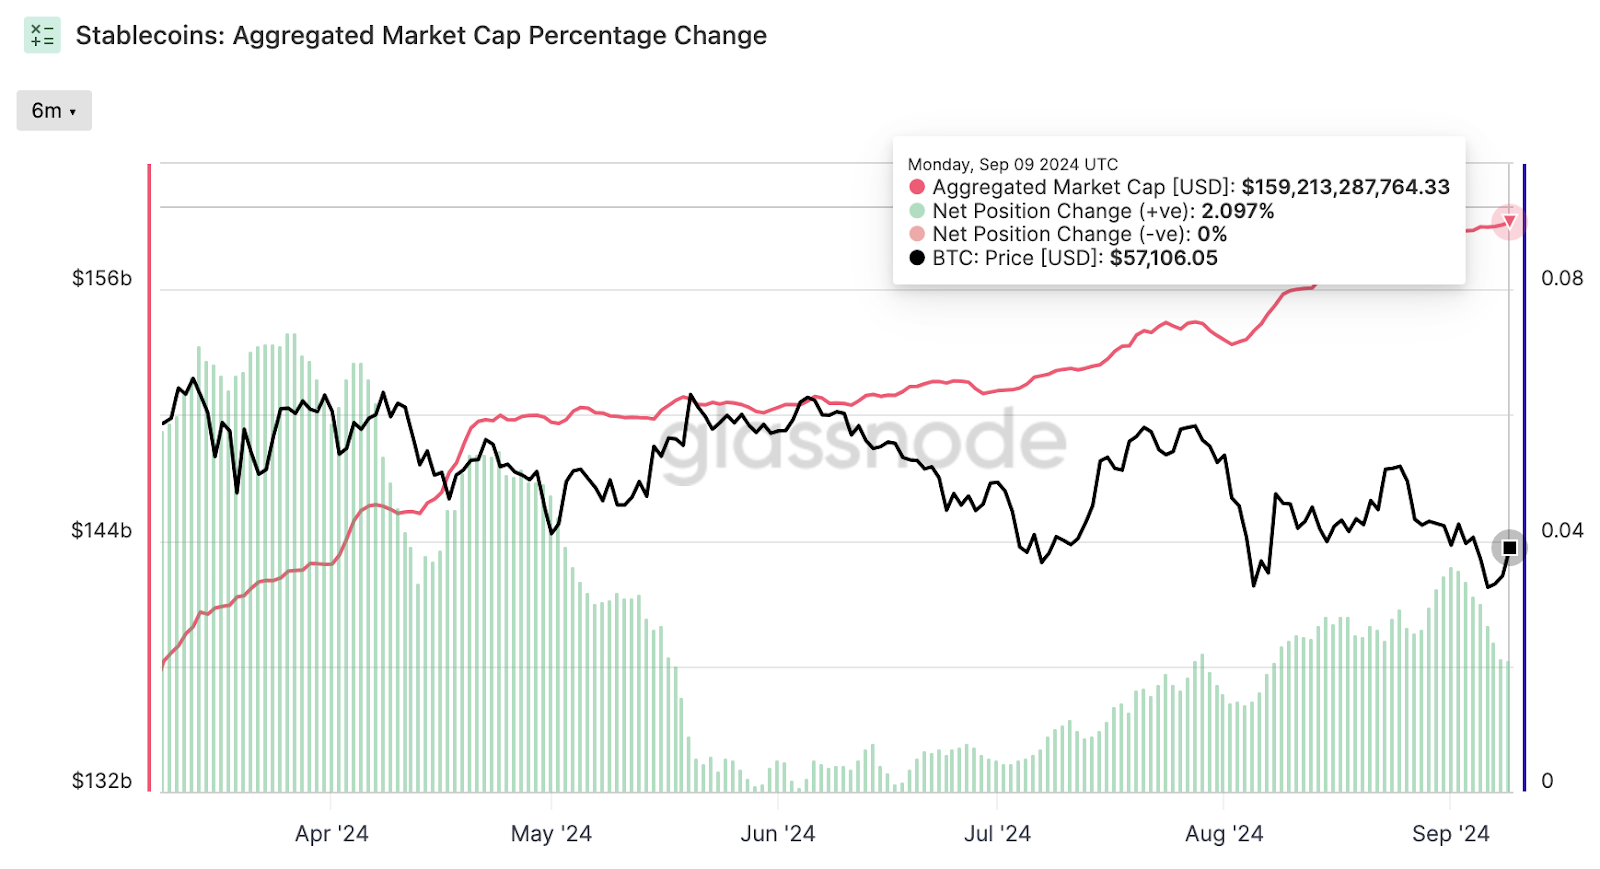
A particularly strange datapoint is aggregate stablecoin marketcap trending up over the past 6 months of slow bleed. As glassnode notes, “Expansions in stablecoin supplies are generally associated with increased demand, and capital inflows into the digital asset space.” However, this has not been the case. Possible explanations include stables being used as collateral to short coins, and/or newly minted stables are being primarily used to generate yield from lending markets or farm protocols such as Ethena. On the bright side, it does suggest a ready availability of funds to fuel an uptrend, should the market begin to gain bullish momentum.
Outlook
Bitcoin continues to underperform the SPX as a risk asset as well as Gold as a safe haven asset, down ~30% on both ratios since cycle highs in March. Accordingly, it’s difficult to predict which narrative price will follow in the context of the previously discussed tailwinds of expected US Fed rate cuts, of which there are expected to be multiple over the coming months.
That being said, given the strong bullish reactions from the low 50k’s over the past 2 months, along with the current attempt at a high timeframe higher low and bullish Q4 seasonality, it does seem reasonable to be cautiously optimistic regarding BTC’s price action over the coming months.
Ethereum
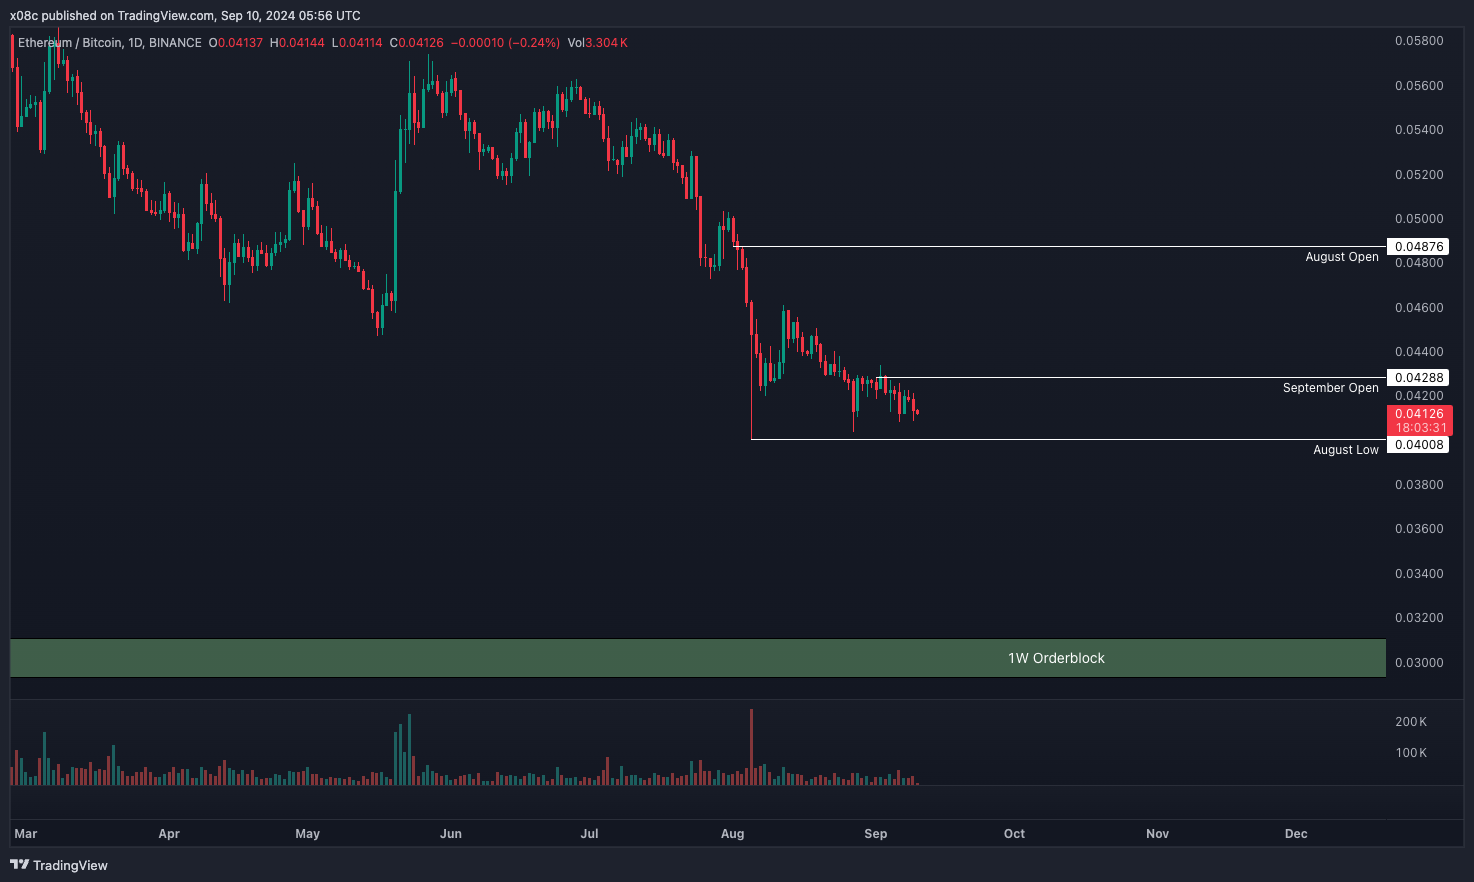
ETH continues it’s 2 year downtrend against BTC, closing the monthly down 12%, with the August low print of 0.04 showing us prices not seen since April ‘21. Acceptance below the 0.04 handle should accelerate the retrace to 1W orderblock support ~0.03, without much technical support in between.
On the fundamental side, we’ve seen L1 protocol revenue from L2s completely evaporate since Dencun in March, causing a reversal in the deflationary trend of ETH supply. Promising SocialFi project Farcaster has seen significantly reduced traction while Friendtech’s team have all but given up. Meanwhile, in LRT land, PenPie was hacked for ~8k ETH + ~$7m in stables while Pendle’s sustainability comes under scrutiny for the low revenue to token incentive ratio that’s become particularly acute since the LRT airdrop farming mania cooled off after Eigenlayer Season 1.
ETF Flows
August saw Ether Spot ETF net inflows totalling $6.2m, a huge improvement over July’s $483.6 in outflows. That being said, there has only been 1 day of inflows since August 15th with net outflows in the first 4 trading days of September totalling $91.1m, bringing total net outflows since inception to $-568.5m.
Outlook
Unchanged from last month’s issue, ETH continues to underperform Bitcoin with technical support near 0.03 on the ratio.
Solana
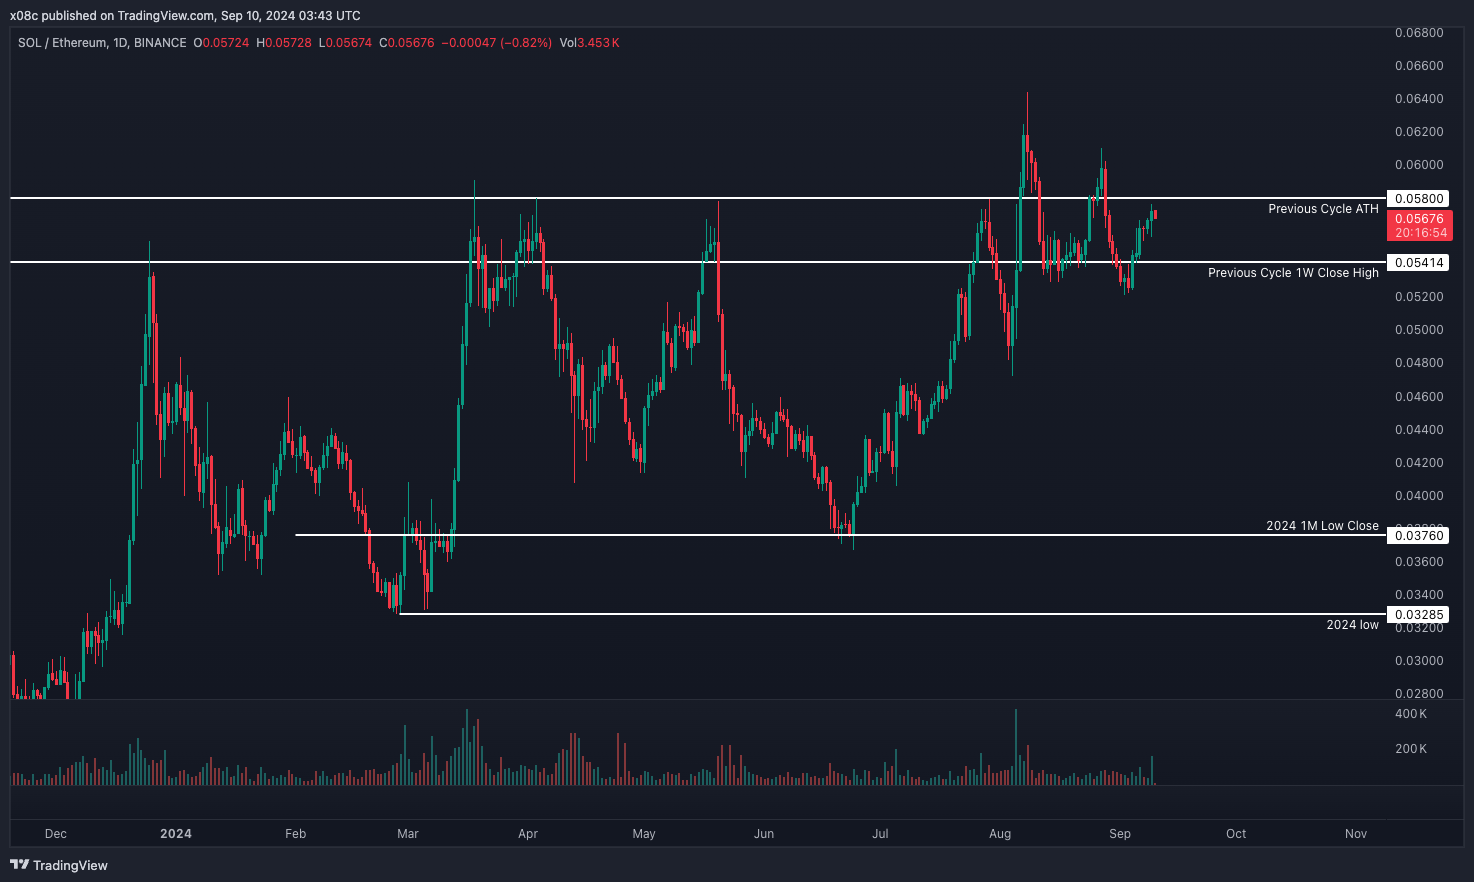
The most important development from last month’s analysis is the failure of the blue-sky breakout on the SOL/ETH ratio. The consolidation since has printed a lower high and lower low already, whilst currently forming a second potential lower high. A subsequent second lower low below 0.052 would provide further confirmation of a downtrend, while bulls will be looking for closes above the mid August high ~0.06 to open up the pathway to new highs.
Closing Thoughts
Little has changed from the past couple months. The market is still stuck between narratives driven by ETFs, rate cuts and regulatory uncertainty related to US presidential elections. Meanwhile, market participants are fatigued from new token saturation on top of airdrop farming programs and extractive meme ponzis which have lost their novelty.
If you’re exposed to coins facing massive supply shocks through unlocks and emissions over the coming months, consider consolidating them into coins with a thesis you can hold conviction through continued sideways price action.
Otherwise, we simply set alerts at price range extremes for coins we like and fill our time having fun in the meatspace until better clearer conditions return.