High timeframe trend trading is perhaps the most simple and low-touch approach to participating in markets. At its most basic, a bullish trend is defined as a series of higher highs and higher lows, but due to intraperiod volatility it can be difficult to identify reversals and failures. For example, how do you differentiate between a higher low and a trend break?
A popular way to approach these issues is smoothing the price trend using simple or exponential moving averages. There are various free and elaborate tools and systems such as the Ichimoku Cloud and Guppy available through charting software like Tradingview, however my favorite is Hull Suite by Insilico due to its high signal to noise ratio.
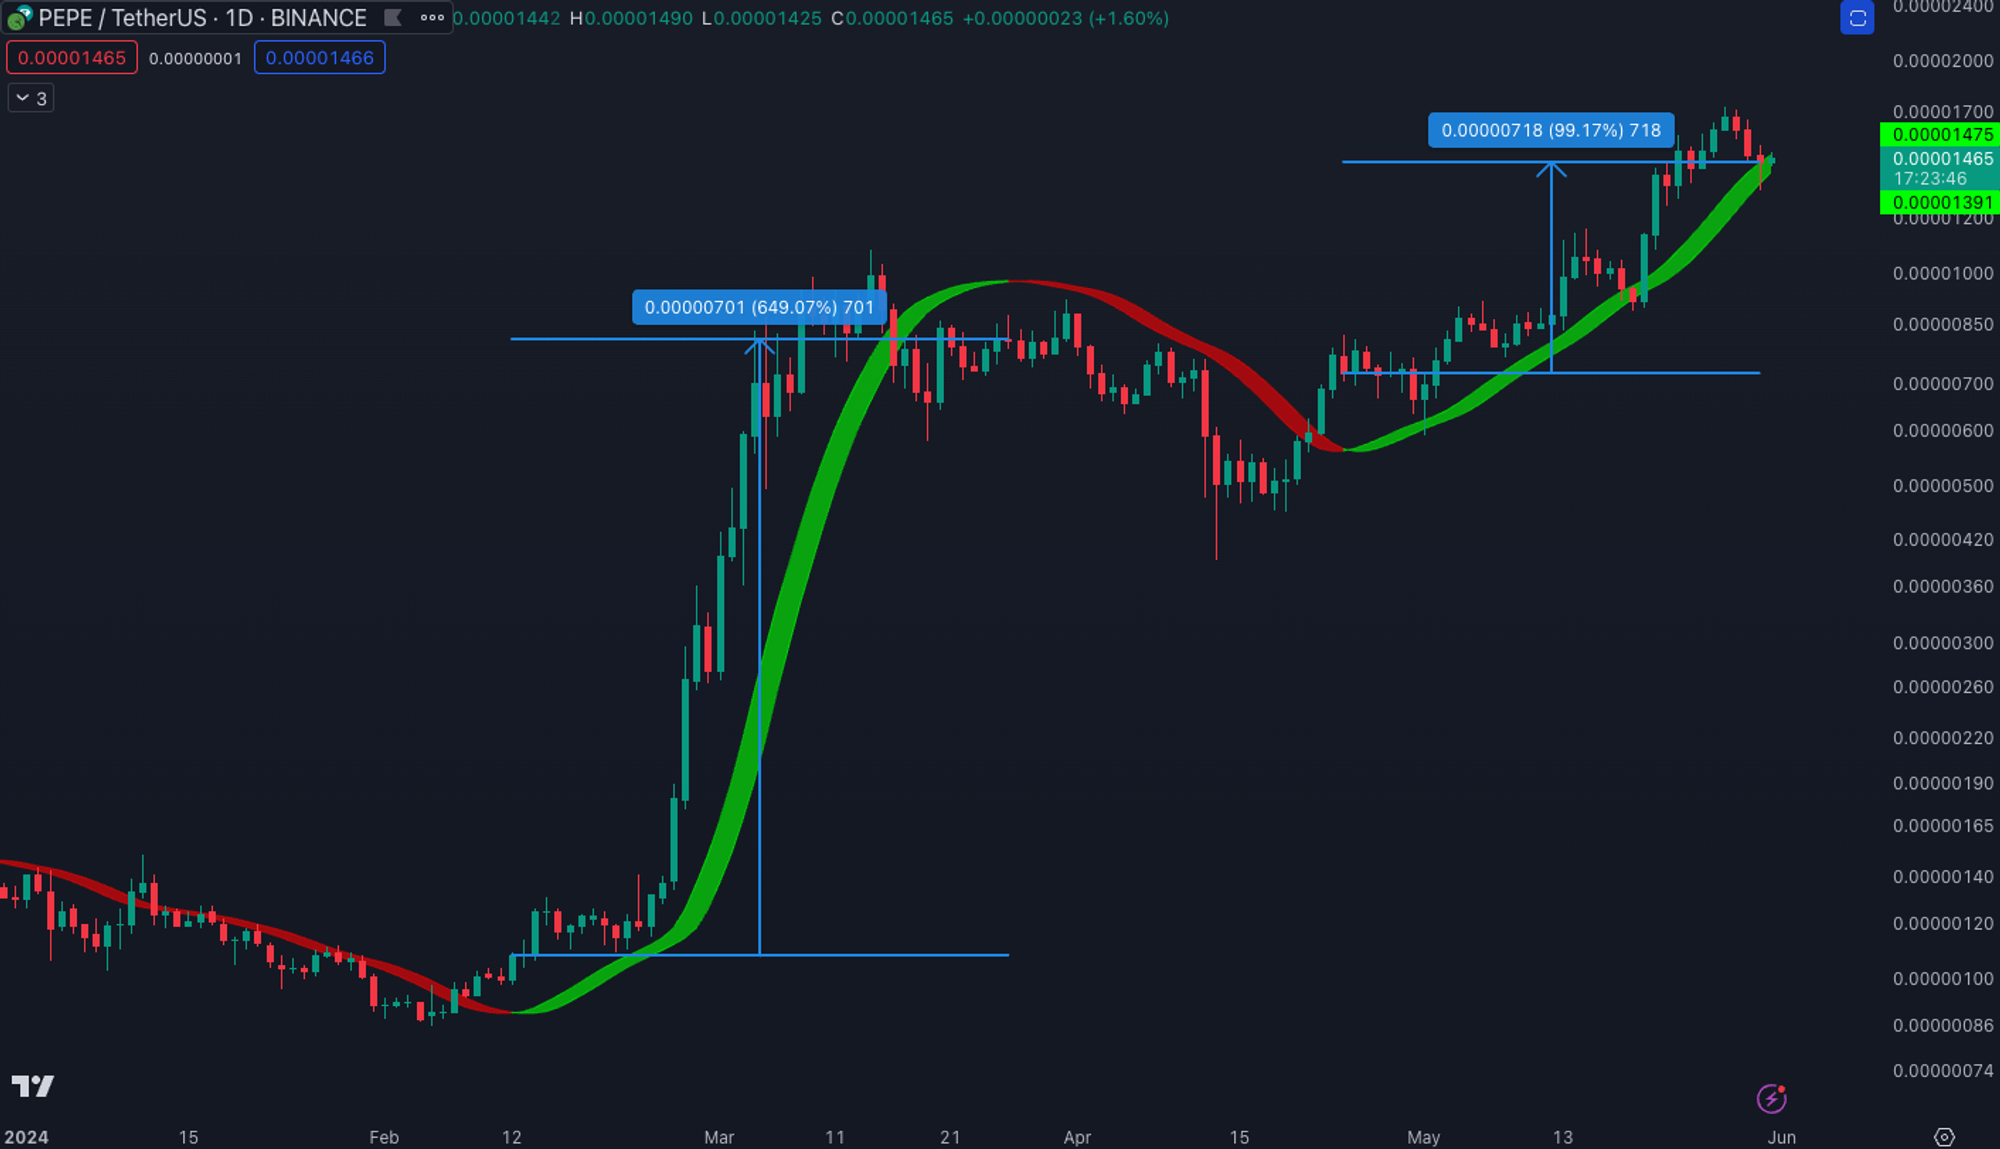
Taking Pepe’s performance year-to-date, Hull has provided only 2 buy signals (ribbon turning from red to green) and 1 sell signal (ribbon turning from green to red), that yielded a 650% for the first long trade and currently is 100% up from entry on the second trade.
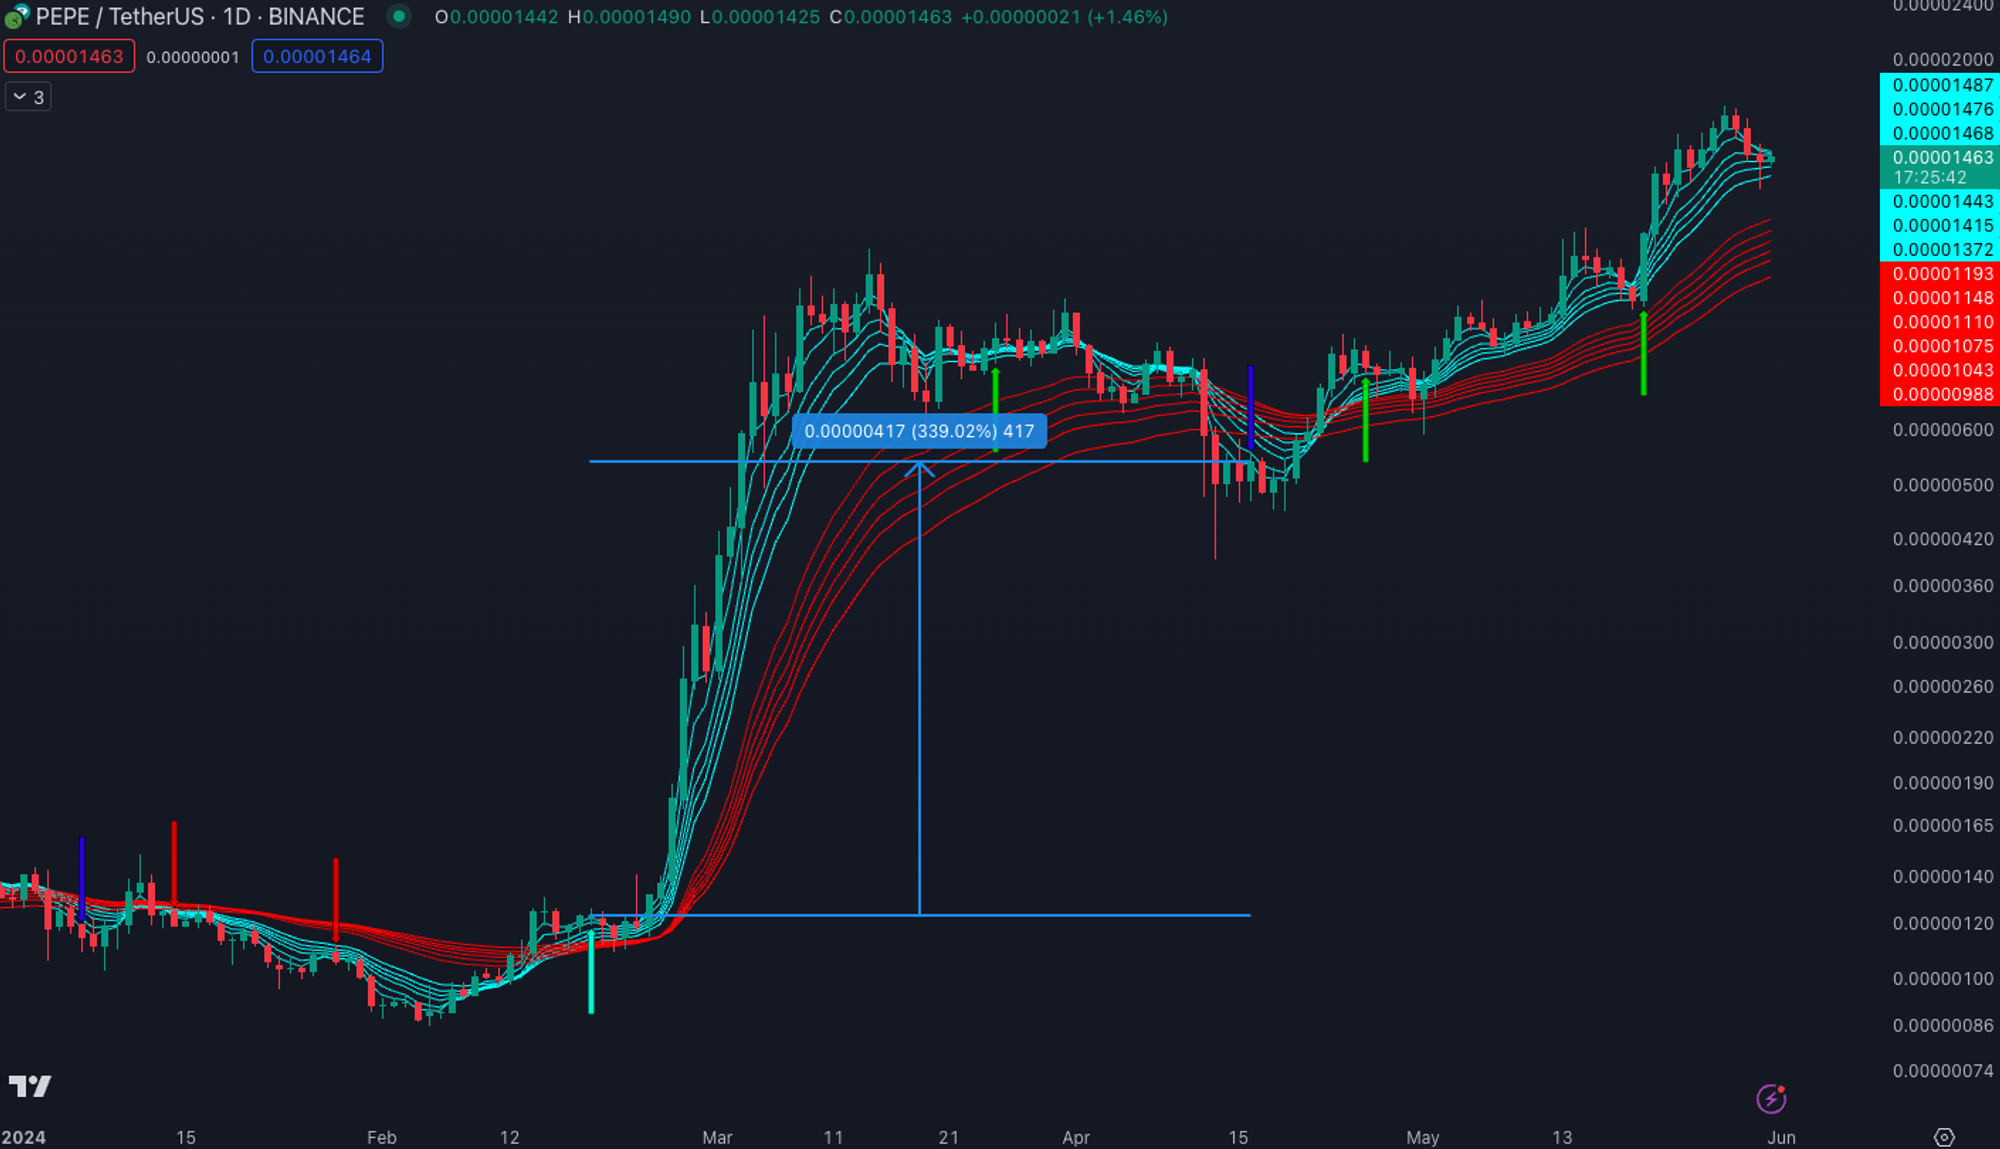
For comparison, the Guppy provided 8 buy and sell signals each over the same period with more moving parts to consolidate when making decisions to enter or exit. Even simplifying the system to only operate on trend break buy signals (cyan up arrow) and trend break sell signals (dark blue down arrow), the late q1 to q2 move yielding a 340% return, 310% less than Hull’s strategy on the same move.
Although neither strategy bottom and top ticks the expansion perfectly, they do what’s most important - catching the meat of the move.