Table of Contents
- Accessing the Dashboard
- Networks
- Overview Metrics
- Transactions per Second (TPS) and Success Rate
- Number of Blocks Created
- Network Fee (SOL) - Transactions
- Successful Vote vs Non-vote Transactions
- Successful Non-vote Transactions vs Instructions - Accounts
- Active Wallets
- New Accounts - Tokens
- New SPL Tokens
- New NFTs - Programs
- Active Programs
- Interaction Volume by Program
- Program Rankings
Solana produces a large volume of onchain data every day. While examining individual transactions or accounts can be useful, it only reveals a small portion of overall network activity.
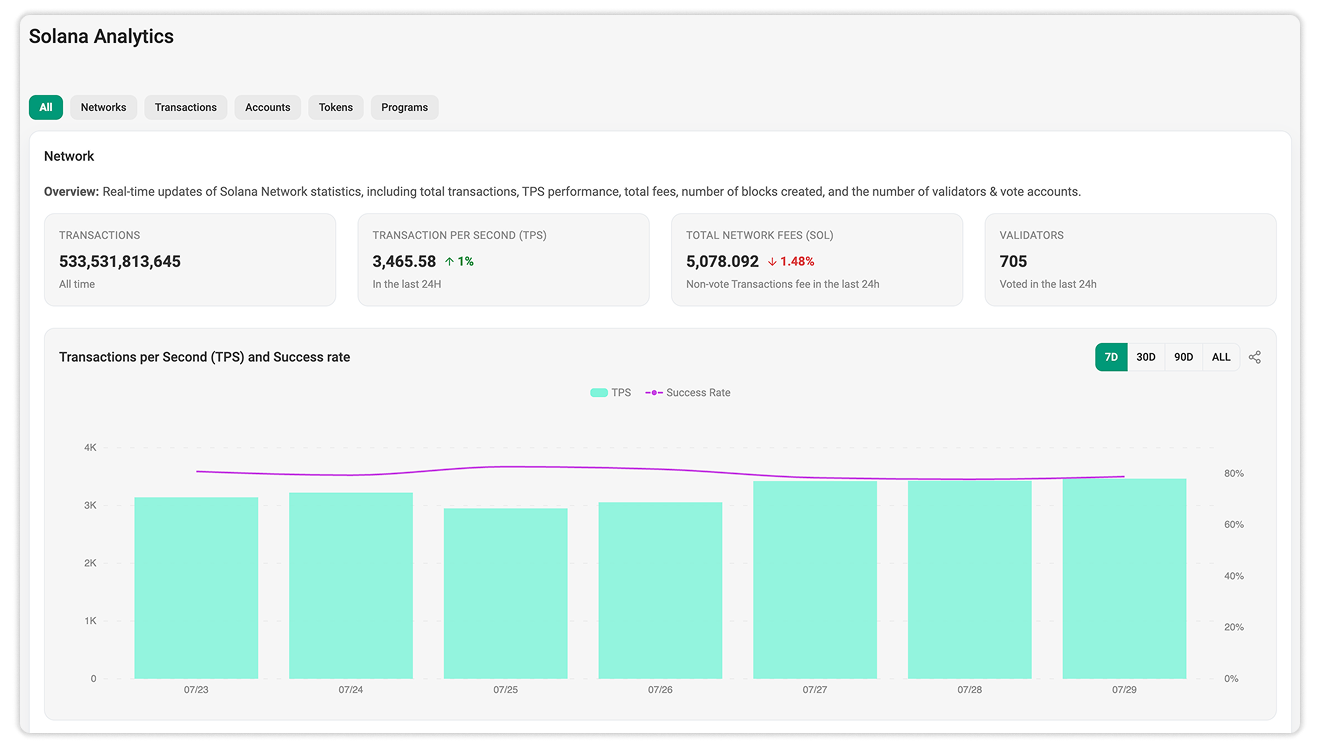
The Solscan Analytics dashboard aggregates key metrics into a single interface. It covers transactions, fees, accounts, tokens, and program activity, with visualizations that help identify patterns over time.
This guide explains each section of the dashboard and clarifies the meaning of the metrics presented.
Accessing the Dashboard
Bookmark the link at Solscan's Solana Network Analytics, or open the dashboard directly from the Analytics dropdown on Solscan homepage and select Solana Network.
At the top of the page, you’ll find five tabs: Networks, Transactions, Accounts, Tokens, and Programs. You can also select All to view every section on a single page.
Most charts allow you to switch between time ranges: 7 Days, 1 Month, 3 Months, and All time. Hover over any data point to see the exact value for that date.
Networks
The Networks section provides a high-level overview of Solana’s performance and activity.
Overview Metrics

At the top, four summary cards display:
- Transactions: The total number of transactions processed on the network, including both vote and non-vote transactions.
- Transactions Per Second (TPS): The rate at which transactions are processed, typically averaged over a recent time window.
- Total Network Fees (SOL): Fees paid by non-vote transactions over the last 24 hours, along with the percentage change from the previous period.
- Validators: The number of validators that participated in consensus voting during the last 24 hours.
Below these cards are three charts showing historical trends.
Transactions per Second (TPS) and Success Rate
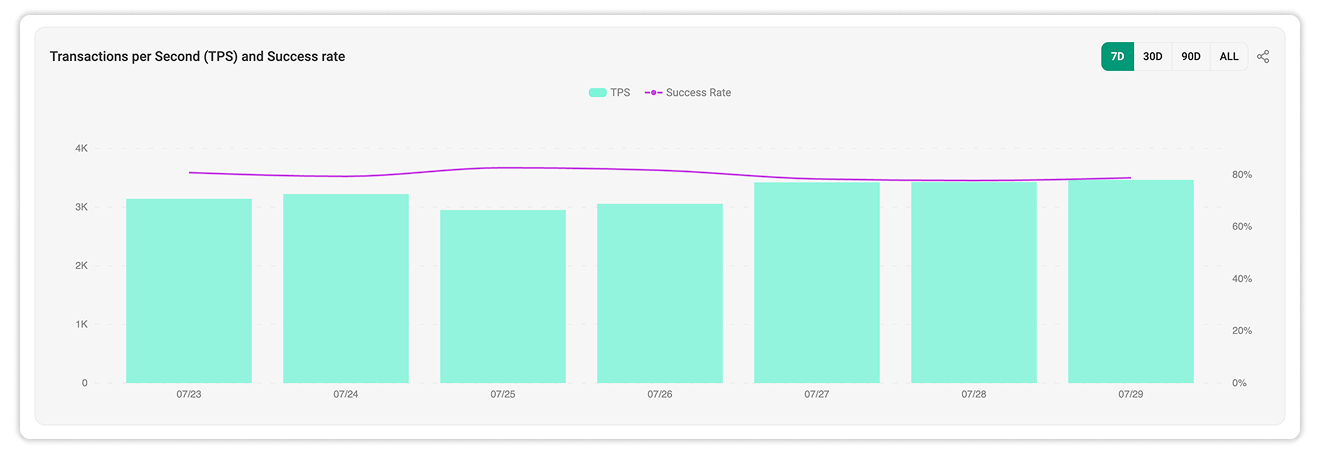
This chart displays daily TPS alongside the transaction success rate.
- TPS reflects overall transaction throughput.
- Success rate represents the percentage of submitted transactions that were successfully processed and finalized.
Viewing these together helps distinguish between increased activity and potential congestion or failure rates.
Number of Blocks Created
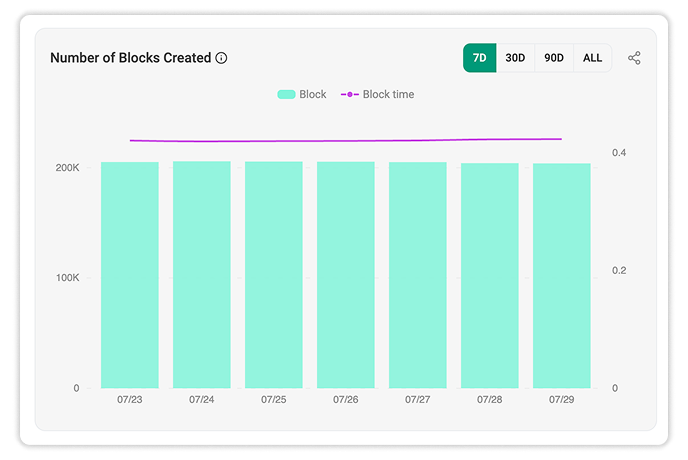
This chart compares:
- The number of blocks produced
- The average block time (the time between consecutive blocks)
Block production reflects how consistently the network is progressing, while block time indicates how quickly new blocks are being generated (The expected block time for Solana is ~0.4s. A higher block time could mean network congestion or outages). Stable values generally suggest steady network operation.
Network Fee (SOL)
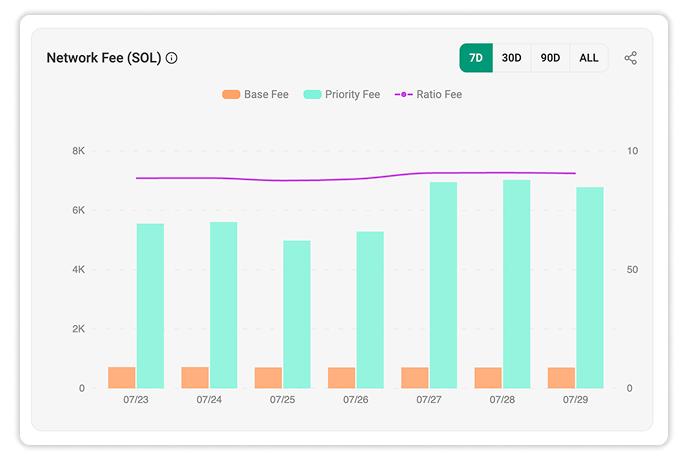
This chart breaks down network fees of non-vote transactions into:
- Base Fee: The standard fee required for processing a transaction.
- Priority Fee: An optional additional fee paid to increase the likelihood of faster inclusion in a block.
- Fee Ratio: The proportion between priority fees and total fees.
This breakdown helps illustrate how users adjust fee strategies, especially during periods of higher demand.
Transactions
The Transactions section distinguishes between different types of activity and compares transaction counts with instruction execution.
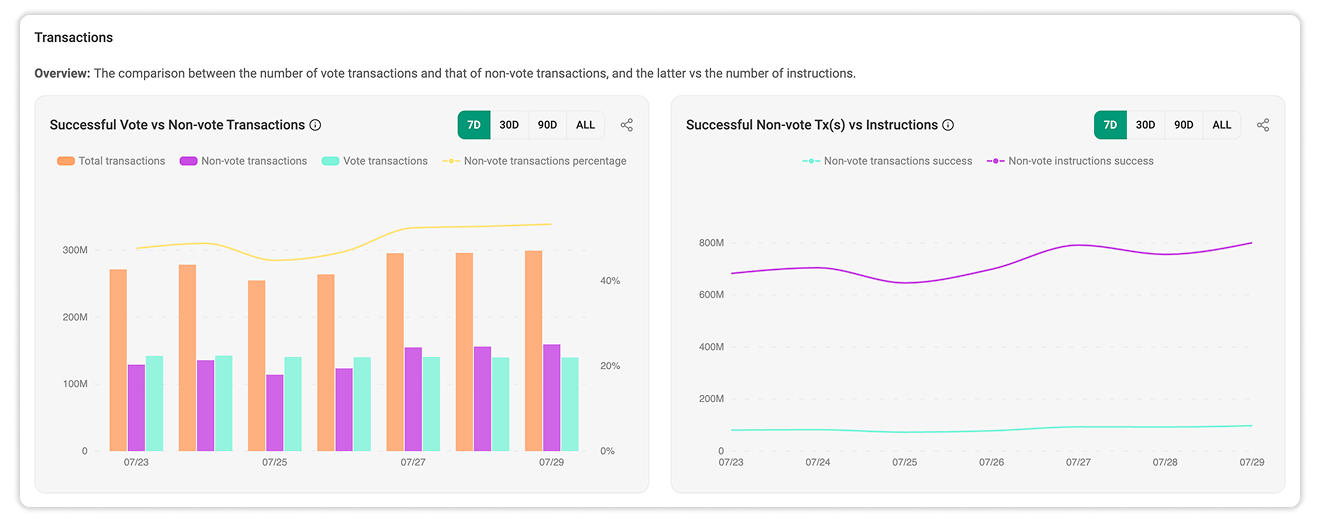
Successful Vote vs Non-vote Transactions
Solana transactions fall into two categories:
- Vote transactions: Submitted by validators as part of the consensus mechanism.
- Non-vote transactions: Generated by users and applications, including transfers, swaps, and smart contract interactions.
The chart compares total successful transactions, vote transactions, and non-vote transactions, and shows the share of non-vote transactions.
Successful Non-vote Transactions vs Instructions
A Solana transaction can include multiple instructions, where each instruction targets its own program, which is required by the Solana runtime.
This chart compares:
- Successful non-vote transactions
- The total number of instructions executed within those transactions
If instruction counts increase faster than transaction counts, it typically indicates that transactions are becoming more complex, executing more operations per transaction.
Accounts
The Accounts section focuses on wallet activity and account creation.
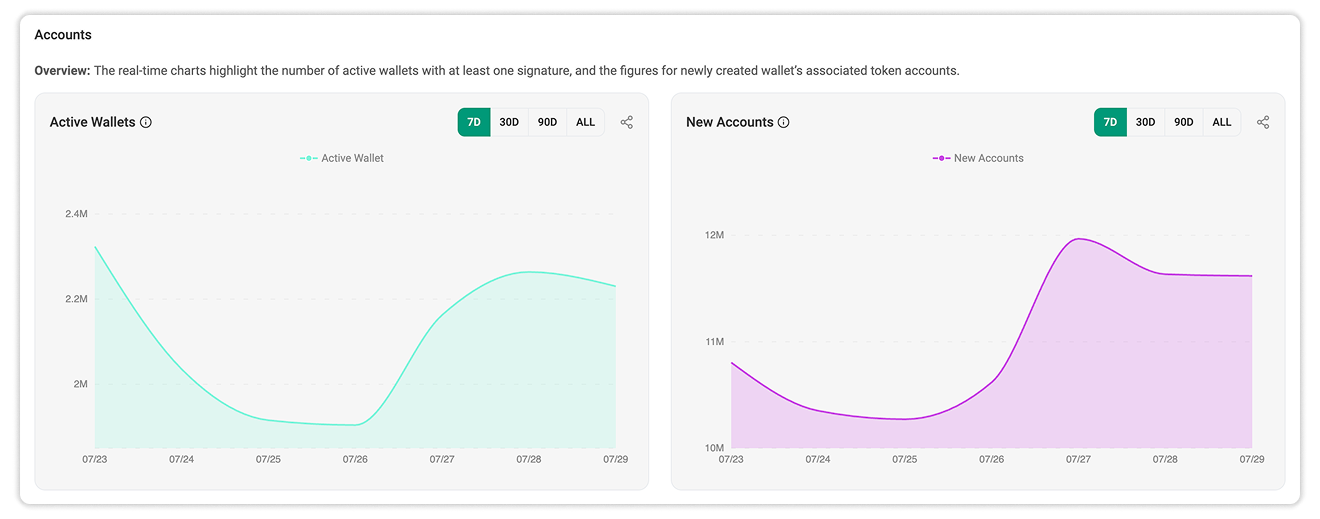
Active Wallets
This chart shows the number of unique wallet addresses that recorded at least one transaction signature during the selected period.
While this metric reflects participation, it does not directly correspond to the number of individual users. A single user may control multiple wallets, and automated systems can also generate activity.
It is most useful for tracking trends over time rather than estimating exact user counts.
New Accounts
This chart tracks newly created associated token accounts.
On Solana, an associated token account (ATA) is a standardized account used to hold a specific SPL token for a wallet. A single wallet can have multiple ATAs, one for each token it holds.
As a result, increases in this metric reflect growth in token account creation, not necessarily growth in unique users.
Tokens
The Tokens section tracks the creation of new digital assets on Solana.
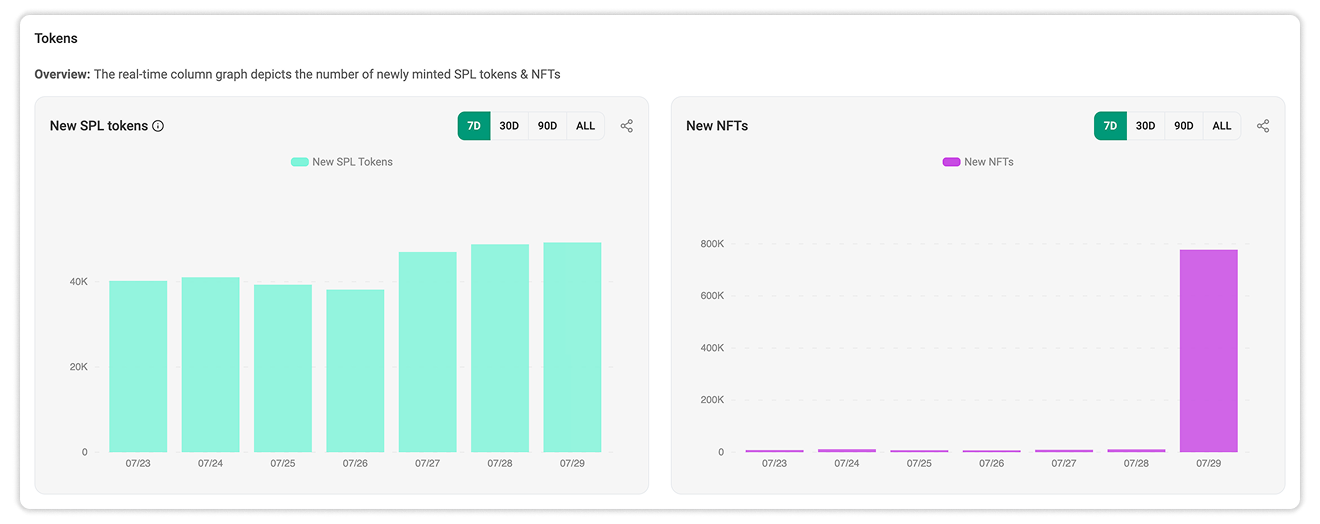
New SPL Tokens
This chart shows the number of new SPL tokens minted over time.
SPL (Solana Program Library) tokens follow a standard interface for fungible tokens on Solana. This metric reflects how many new tokens are created, but does not indicate their adoption, liquidity, or long-term viability.
New NFTs
This chart shows the number of newly minted NFTs over the selected period.
NFT minting volume reflects creation activity. It does not directly measure trading volume, user demand, or the success of individual collections.
Programs
The Programs section highlights which applications and smart contracts are driving activity on Solana.
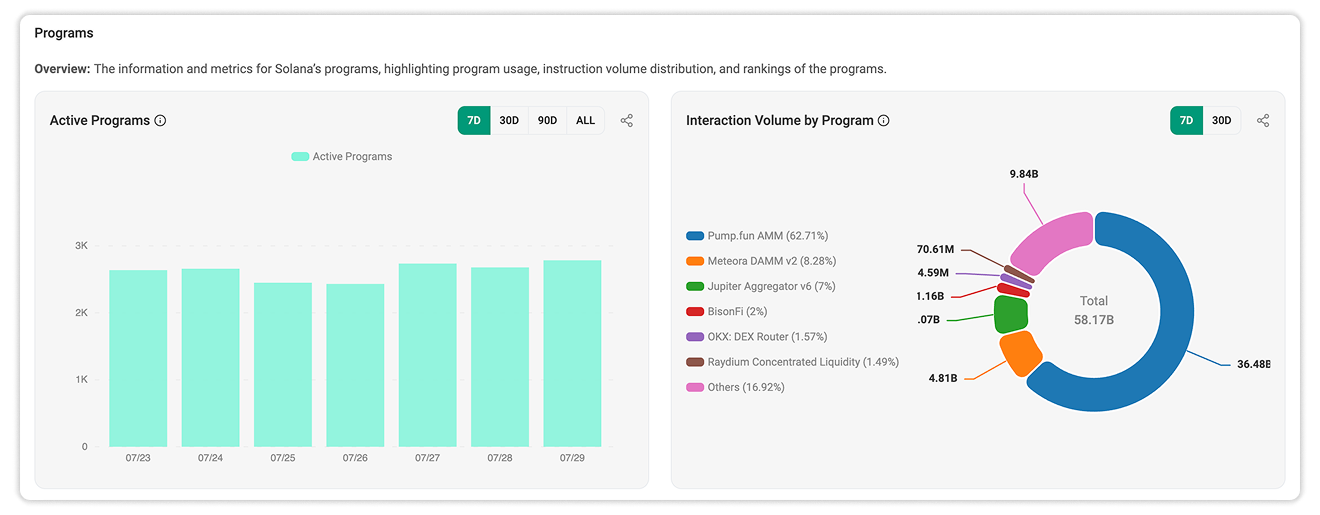
Active Programs
This chart tracks the number of programs (smart contracts) that recorded at least one interaction during each period.
An increase in active programs may indicate broader application usage or new deployments, while decreases may reflect consolidation or reduced activity.
Interaction Volume by Program
This distribution chart shows how total instruction interactions are divided among programs.
Each interaction represents an instruction executed by a program. The chart highlights the largest contributors and groups smaller ones under Others, helping identify whether activity is concentrated or distributed across the ecosystem.
Program Rankings
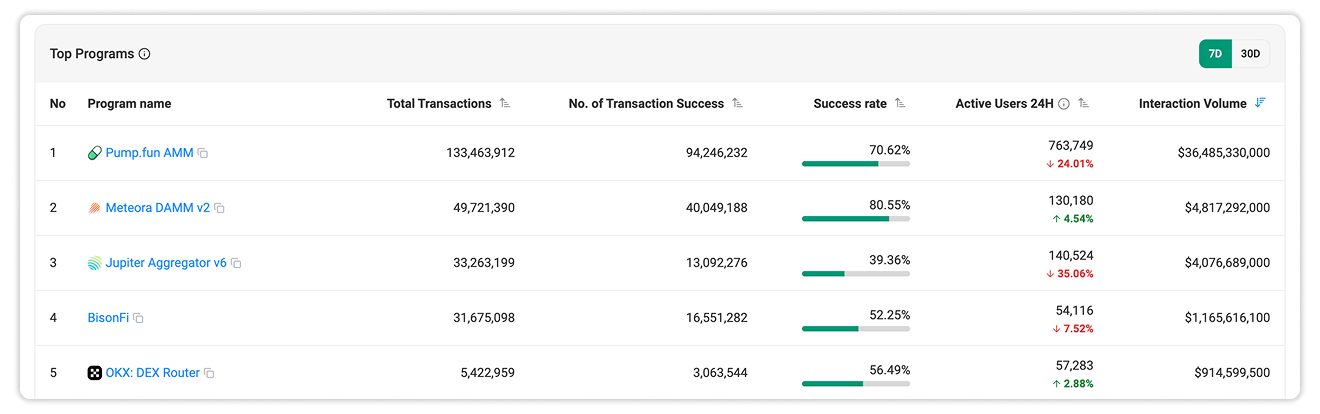
The ranking table provides detailed metrics for individual programs, including:
- Program name
- Total Transactions: Total number of transactions involving the program.
- No. of Transaction Success: Number of transactions that executed successfully.
- Success rate: Percentage of successful transactions.
- Active Users 24H: Number of unique wallet addresses interacting with the program in the last 24 hours.
- Interaction Volume: Total number of instructions executed by the program.
By default, programs are ranked by interaction volume, but you can sort the table by any of the available metrics to compare different aspects of activity. Reviewing multiple metrics together provides a more complete understanding of how each program is used.