Table of Contents
- Accessing the Dashboard
- Overview
- Stablecoin Supply and Distribution
- Top Holding Accounts
- Daily and Weekly Total Supply
- Holders by Stablecoin
- Holder Distribution
- Daily Holders by Stablecoin - Transfer
- Daily Transfer Activity
- Daily Transactions by Stablecoin
- Daily Transfer Value by Stablecoin
- Active Transfer Users
- Transfer Volume Distribution
- Top Account Inflows and Outflows - Exchange
- Daily Exchange Flows
- Daily Inflow and Outflow by Exchange
- Daily Net Value by Exchange
- Daily Net Value Across All Exchanges
Stablecoins are a major part of activity on Solana, supporting payments, trading, liquidity, and transfers across the network. However, market capitalization alone does not show how these assets are distributed or how actively they move on-chain.
Solscan Stablecoin Dashboard brings supply, holder, transfer, and exchange data into one place. It provides a broader view of the stablecoin economy on Solana, from market composition and ownership distribution to transaction activity and exchange flows.
Accessing the Dashboard
Bookmark the link at Solscan Stablecoin Dashboard, or open the dashboard directly from the Analytics dropdown on Solscan homepage, select Analysis > Stablecoin Dashboard.
At the top of the page, you’ll find three tabs: Overview, Transfer, and Exchanges. You can also select All to view every section on a single page.
Interactive charts allow users to inspect individual dates, assets, balance ranges, and entities. Selected datasets also provide API access, enabling developers and analysts to retrieve stablecoin data for further analysis or integration into external applications.
Overview
The Overview section presents the current state and historical development of Solana’s stablecoin market.
At the top of the dashboard, four header metrics summarize network activity:
- Total Market Cap: The combined circulating market cap of tracked stablecoins on Solana.
- Total Holders: The number of unique accounts currently holding any stablecoins.
- Number of Transfer Transactions (Last 1 Day): The total number of stablecoin transfer transactions recorded during the last 24 hours.
- Total Transfer Value (24H): The combined USD value transferred across tracked stablecoins over the past 24 hours.

Stablecoin Supply and Distribution
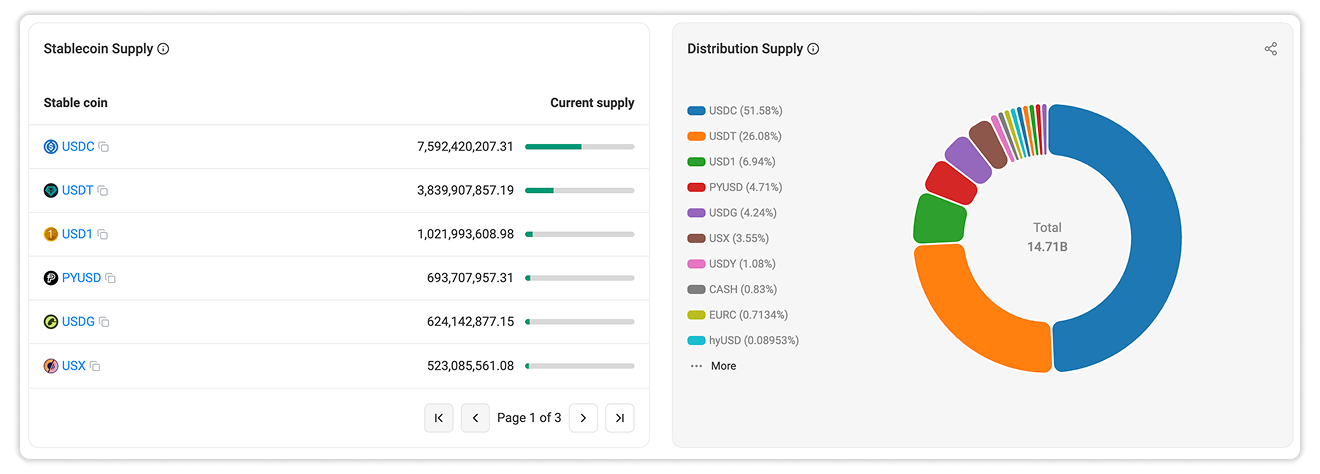
The Stablecoin Supply and Distribution Supply charts show how the total stablecoin market is divided among individual assets.
These charts make it easier to compare the relative market share of all tracked stablecoins. They also show whether stablecoin liquidity on Solana is concentrated in a small number of assets or distributed across a broader range of issuers.
Users can interact with the pie chart by clicking on a stablecoin in the Distribution Supply chart to hide that token from the visualization, allowing them to focus on the remaining assets and examine the underlying composition in more detail.
Top Holding Accounts
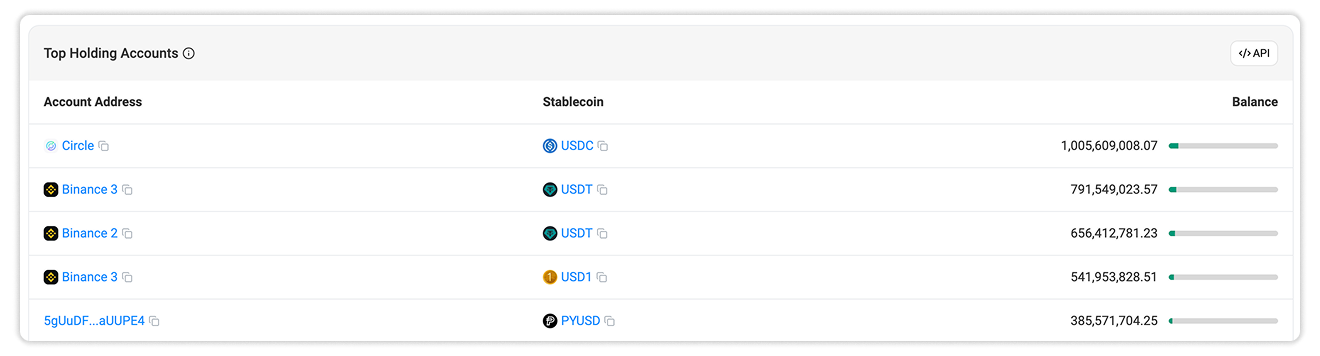
The Top Holding Accounts table ranks accounts by their stablecoin balances. Each entry includes: Account address, Stablecoin held, and Current balance.
Where an address has been identified, Solscan labels provide additional context around exchanges, issuers, treasuries, protocols, and other known entities.
This table helps reveal where large stablecoin balances are held and how much of the supply is concentrated among major accounts.
Daily and Weekly Total Supply
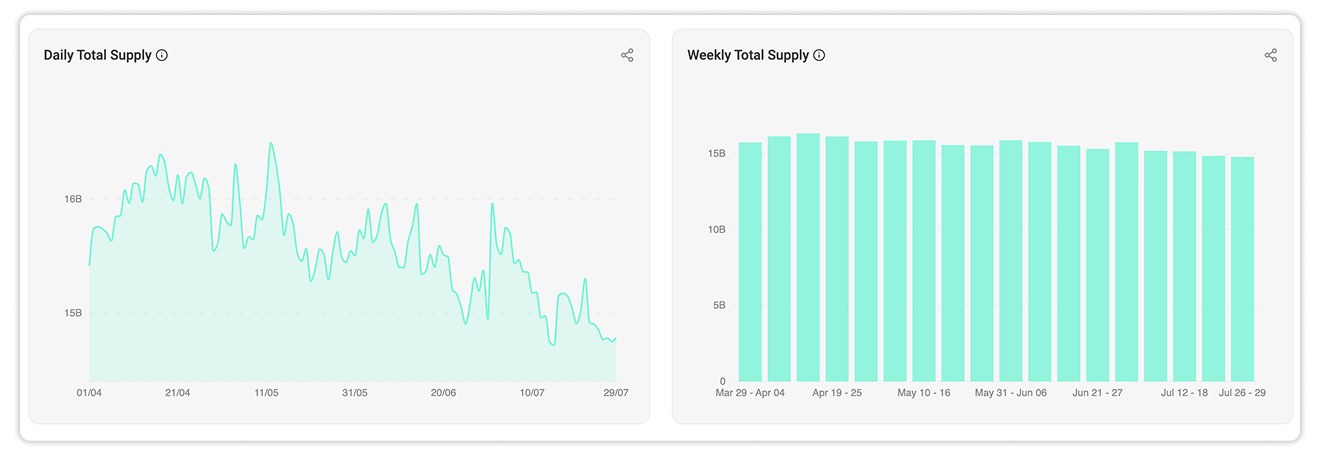
The Daily Total Supply and Weekly Total Supply charts track changes in aggregate stablecoin supply over time.
The daily chart provides a more granular view of short-term changes, while the weekly chart makes broader trends easier to identify. Increases or decreases may reflect stablecoin issuance, redemptions, cross-chain movements, or changes in demand across the Solana ecosystem.
Holders by Stablecoin
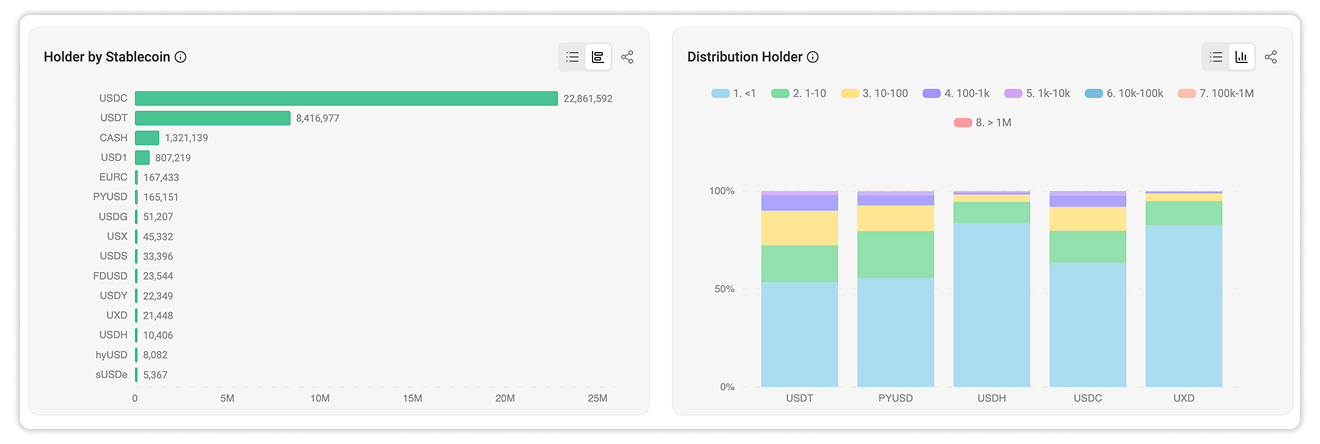
The Holder by Stablecoin chart compares the number of holders associated with each tracked asset.
Holder Distribution
The Distribution Holder chart groups holders into balance ranges, from accounts holding less than one unit to accounts holding more than one million units.
The chart can be used to compare the ownership structure of major stablecoins and determine whether balances are primarily distributed among smaller (retail) wallets or concentrated in larger (whale) accounts.
Daily Holders by Stablecoin
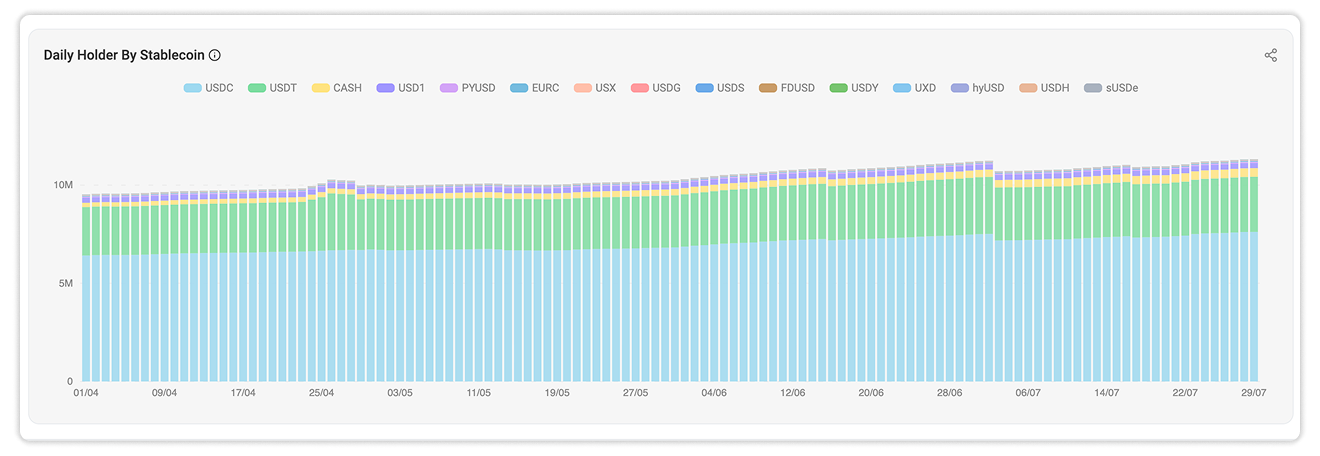
The Daily Holder by Stablecoin chart tracks daily changes in holder counts over time by each tracked stablecoin.
Transfer
The Transfer section focuses on how stablecoins move across Solana. It combines transaction counts, transfer values, active-user behavior, volume distribution, and the largest account flows.
Daily Transfer Activity
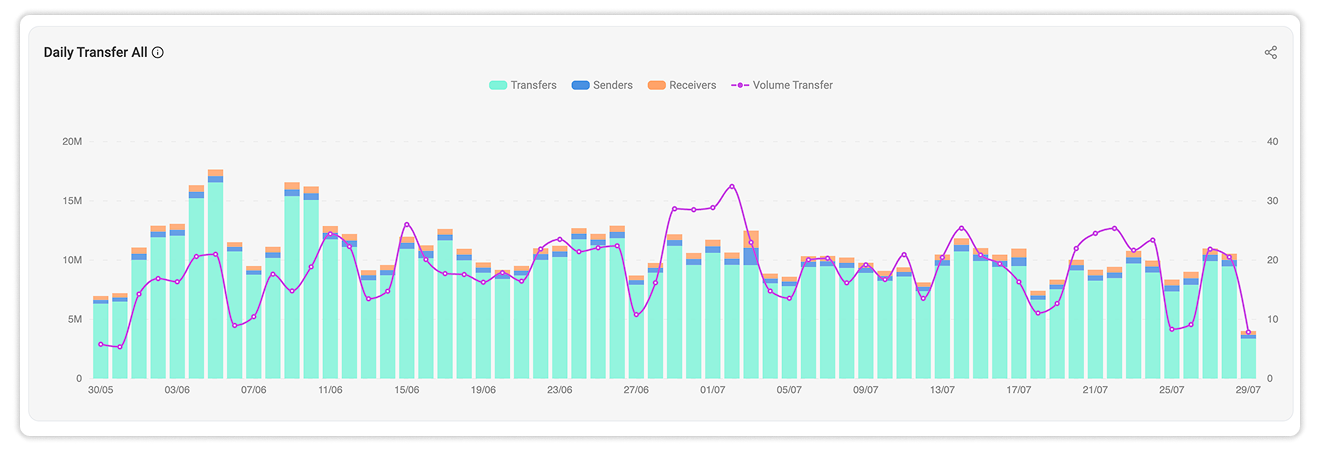
The Daily Transfer All chart provides a combined view of stablecoin activity over time, including transfer counts, the number of senders and receivers, and total transfer volume across tracked stablecoins.
Presenting these metrics together helps distinguish between the number of on-chain actions, the breadth of participants involved, and the value moved through the network.
Daily Transactions by Stablecoin
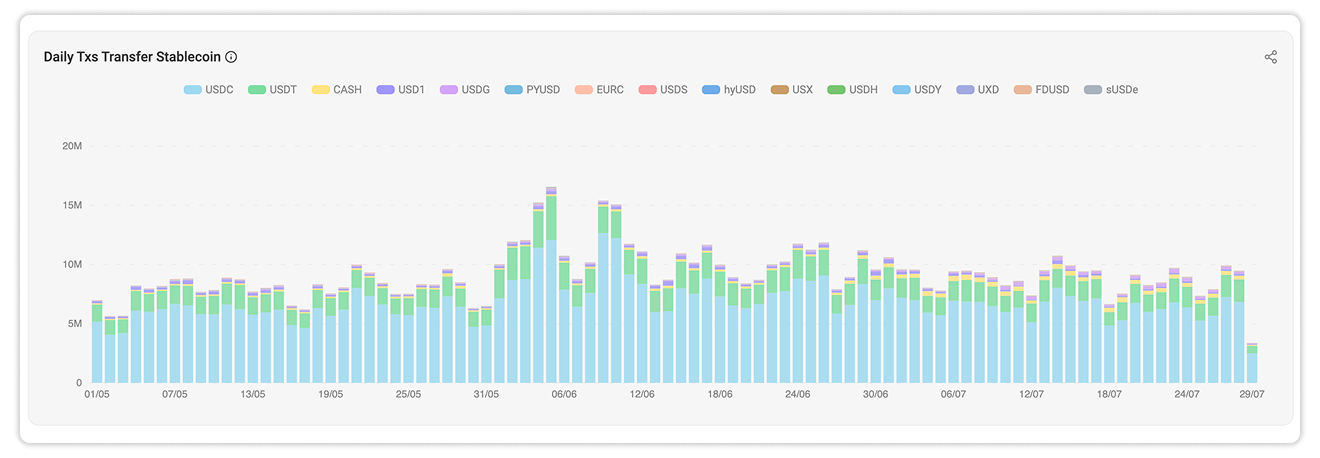
The Daily Txs Transfer Stablecoin chart breaks down daily transfer transactions by asset.
This view shows which stablecoins account for the largest share of transaction activity and how that composition changes from one day to another. It can also reveal whether an increase in network activity is broad-based or concentrated in a specific stablecoin.
Daily Transfer Value by Stablecoin
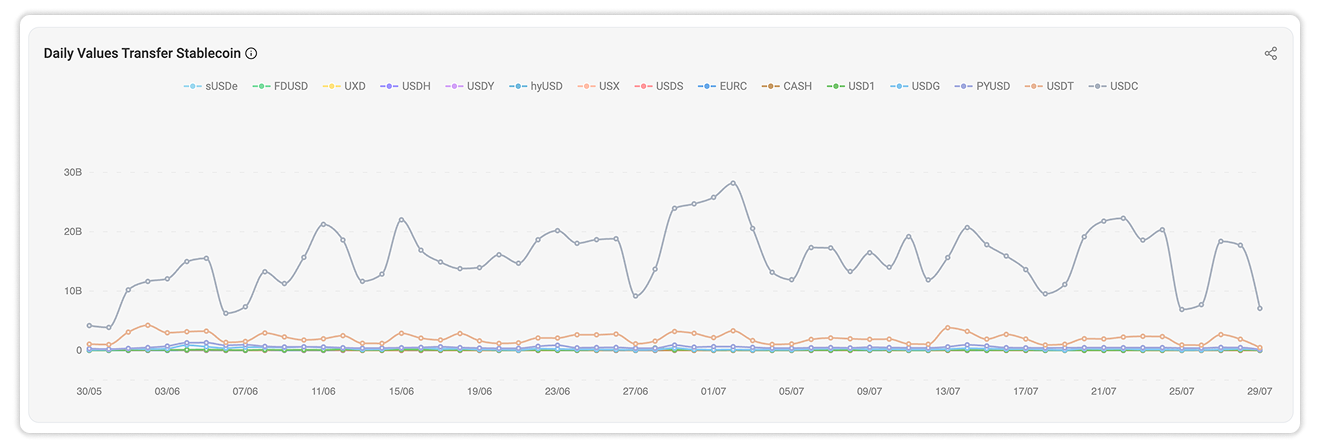
The Daily Values Transfer Stablecoin chart tracks the value transferred per each stablecoin over time.
Comparing this chart with transaction counts adds an important layer of context. A stablecoin may lead in transaction frequency while another accounts for a larger share of transferred value.
Active Transfer Users
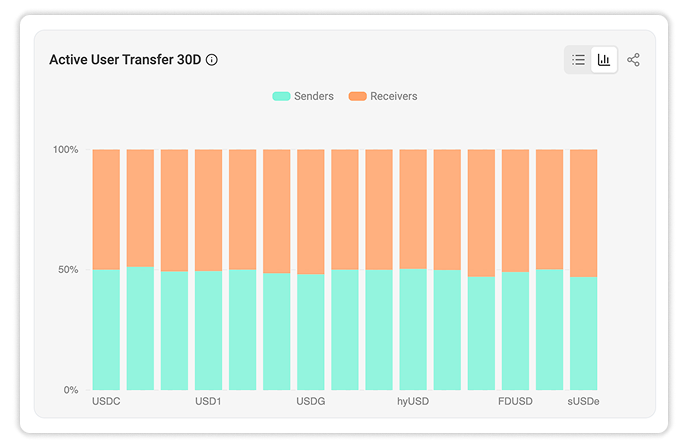
The Active User Transfer 30D chart compares the number of active senders and receivers for each tracked stablecoin over the latest 30-day period.
Transfer Volume Distribution
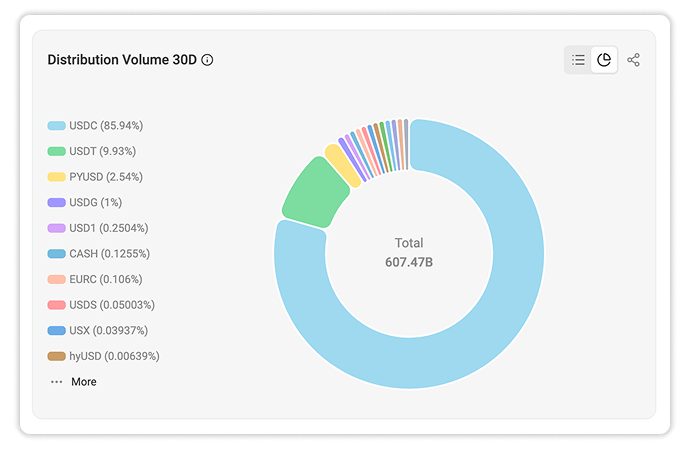
The Distribution Volume 30D chart shows each stablecoin’s share of total transfer volume over the past 30 days.
Top Account Inflows and Outflows
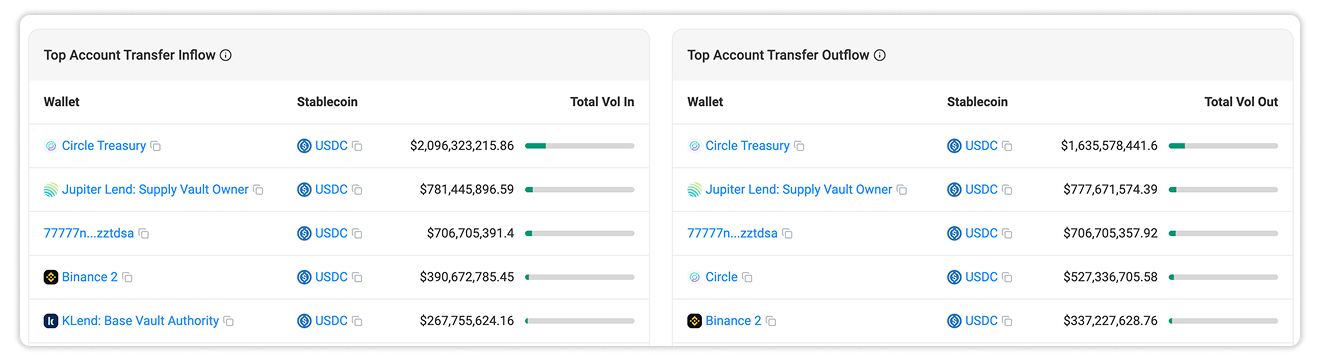
The Top Account Transfer Inflow and Top Account Transfer Outflow tables rank wallets based on the stablecoin volume received or sent by each wallet.
Each table includes:
- Wallet address or label
- Stablecoin
- Total value transferred in or out
These rankings make it easier to identify the accounts responsible for the largest stablecoin movements by volume. Solscan labels also help distinguish known exchanges, protocol-controlled accounts, treasuries, and other entities from unidentified wallets.
The tables should be interpreted as records of on-chain movement rather than direct evidence of buying, selling, deposits, or withdrawals. A large transfer may represent internal treasury management, protocol operations, exchange wallet rebalancing, or another type of account activity.
Exchange
The Exchange section tracks stablecoin flows on supported centralized exchange.
This data provides visibility into the amount of stablecoin value entering and leaving exchanges, as well as the contribution of individual platforms to overall exchange activity.
Daily Exchange Flows
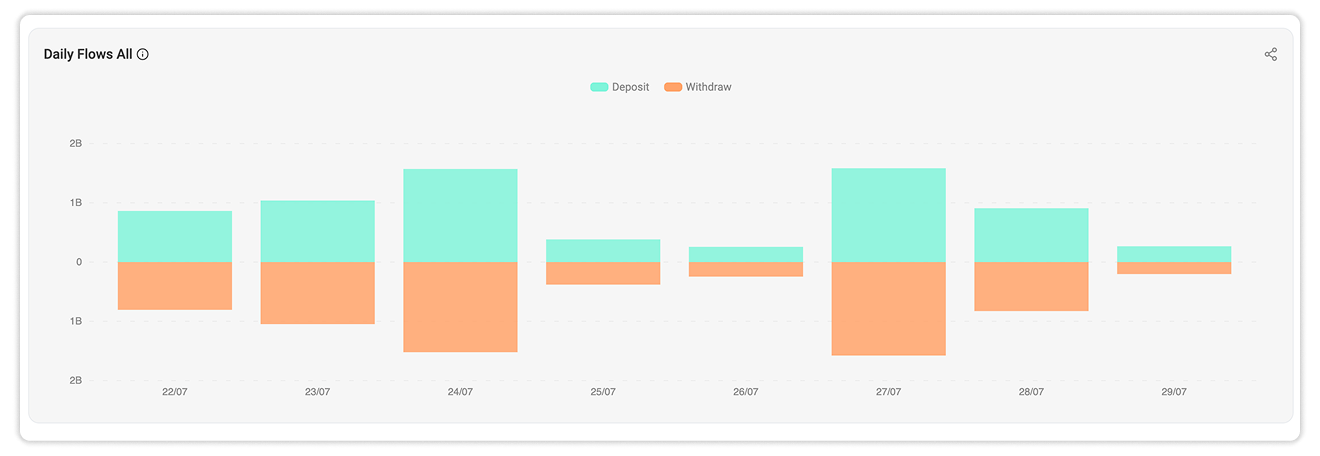
The Daily Flows All chart compares total stablecoin deposits and withdrawals across all supported centralized exchanges.
Deposits represent stablecoin value flowing into identified exchange accounts, while withdrawals represent value leaving them. Viewing both directions together makes it easier to assess the scale and direction of daily exchange-related movement.
These flows should not automatically be treated as buy or sell activity. Users may transfer stablecoins for trading, custody, settlement, account management, or internal wallet operations.
Daily Inflow and Outflow by Exchange
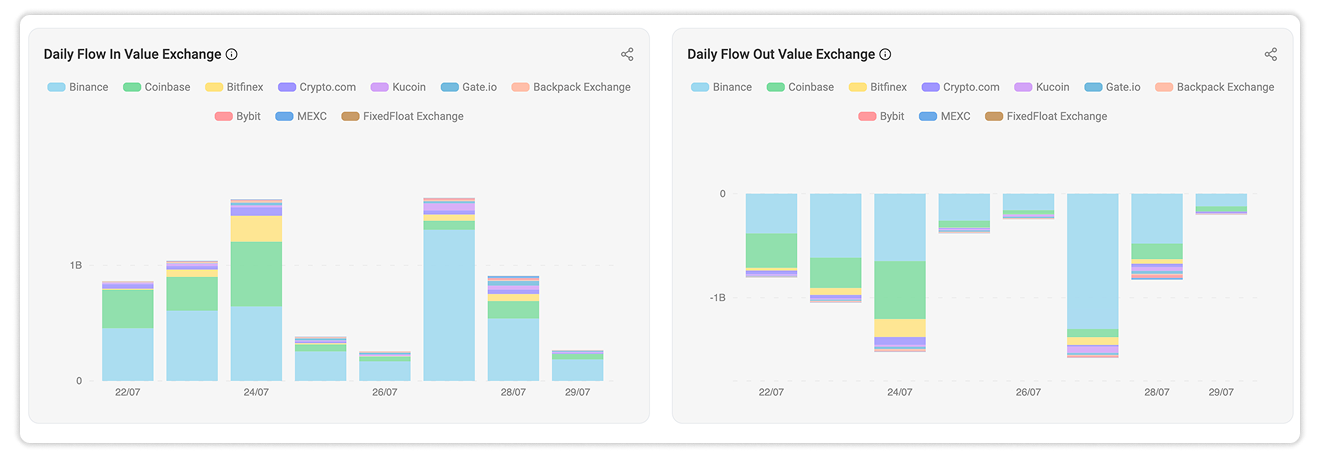
The Daily Flow In Value Exchange and Daily Flow Out Value Exchange charts break down deposits and withdrawals by individual exchange.
These charts show which exchanges account for the largest stablecoin movements on a given day. They also help identify whether an aggregate change is distributed across several exchanges or driven primarily by one platform.
Daily Net Value by Exchange
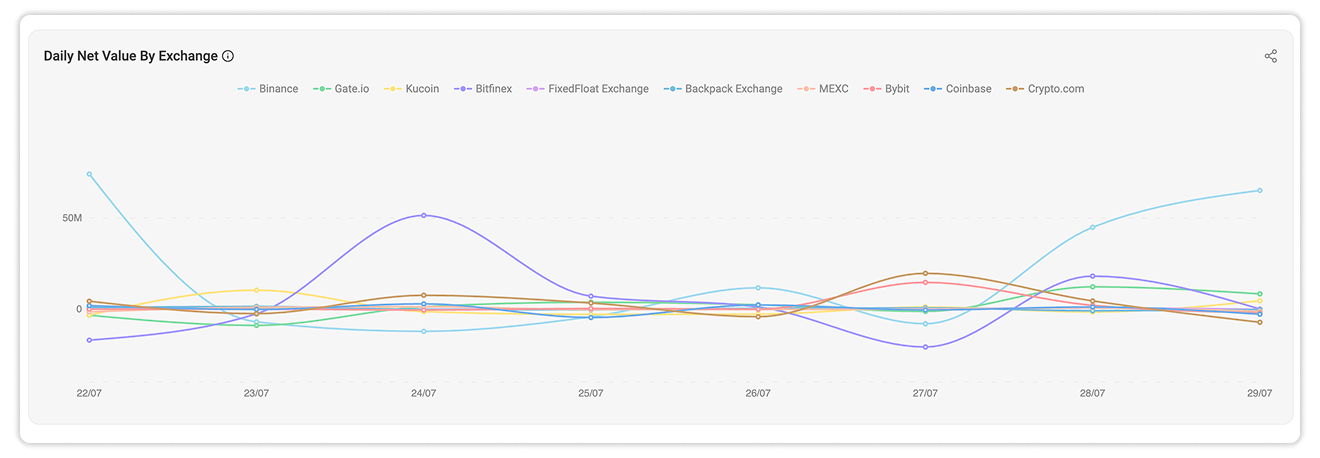
The Daily Net Value by Exchange chart calculates the difference between stablecoin inflows and outflows for each tracked exchange.
A positive value indicates that deposits exceeded withdrawals during the period, while a negative value indicates that withdrawals were larger than deposits.
This comparison provides more context than gross flow alone, particularly when an exchange records high activity in both directions.
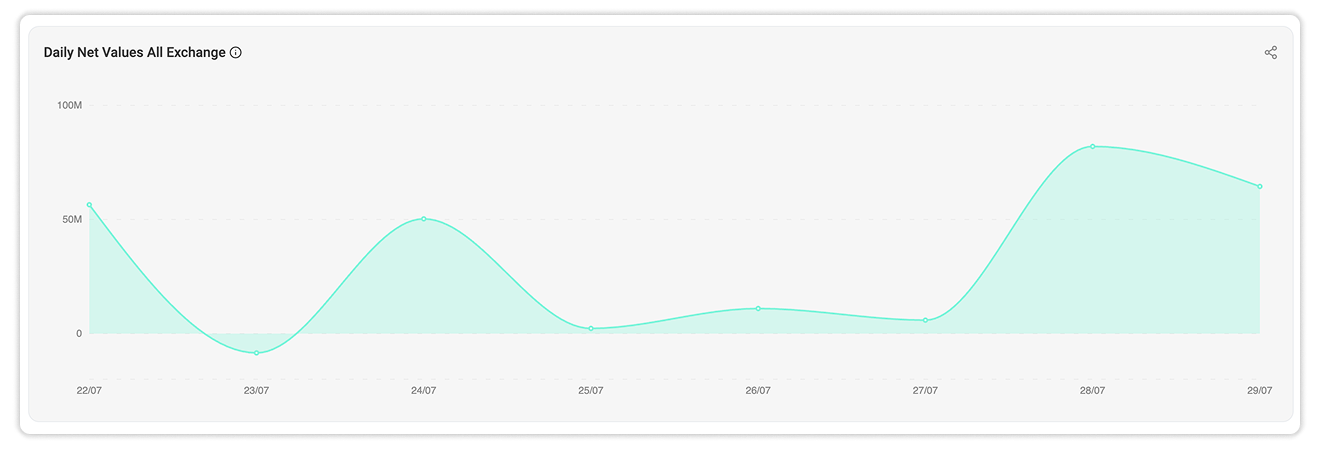
Daily Net Value Across All Exchanges
The Daily Net Values All Exchange chart aggregates net stablecoin flows across all supported exchanges.
It offers a network-level view of whether identified exchange wallets collectively received or released more stablecoin value during each period. This can help surface changes in exchange-related liquidity, although it should be read alongside gross inflows, gross outflows, and individual exchange data.